Detailed Modeling by Former Tax Director of the Department of Revenue Compares Existing Production Taxes Under Senate Bill 21 with Ballot Measure 1
The comparison reveals the State has paid and owes more in cashable credits than it has received in production taxes under SB21. It also reveals permitting unrelated costs to be deducted from and giving unnecessary $8 per revenue bbl. credits to our major fields significantly and improperly reduce Alaskans’ share of production taxes.
FOR IMMEDIATE RELEASE
October 6, 2020
Contact: Robin Brena (907) 258-2000 (work) or (907) 223-1000 (cell) or David Dunsmore (907) 278-8000 (headquarters) or (907) 830-4288 (cell)
Today, backers of Ballot Measure 1 revealed the results of detailed modeling done on Ballot Measure 1 by the former Tax Director for the Division of Revenue, Ken Alper. Alper has modeled oil tax policy in Alaska for decades and is a well-respected production tax and policy expert who is often called upon to model and analyze production tax proposals. “Ken Alper is one of the foremost experts on Alaska’s oil tax policies, and his modeling and presentations to the Legislature over the years have proven invaluable,” observed former Chair of House Finance and Co-Chair of House Resources Paul Seaton (R).
Seaton further commented, “Ballot Measure 1 changes the minimum rate, eliminates unnecessary credits, ring fences, and adds progressivity.” “These are all sound oil policies the Legislature has been unable to maintain because of the political influence of the major oil companies,” Seaton observed. “We have had higher minimum rates, no credits, ring fencing, and progressivity in various forms in the past.” “Most recently, the Legislature considered these oil policies with HB111, HB411, and SB21, and the Legislature had the full opportunity to consider these oil policies in the context of Ballot Measure 1 on three separate occasions, when it held hearings in the Senate and House on Ballot Measure 1 and when Ballot Measure 1 was introduced in bill form in SB129,” Seaton offered. “The oil policies advanced by Ballot Measure 1 are sound, have been in place in the past, and the Legislature has had ample opportunity to consider these sound policies,” Seaton concluded.
Vote Yes has chosen to set forth some of the detailed modeling results prepared by KMA Associates in which Alper is the principal because of the “confusion being caused by our opposition misrepresenting Ballot Measure 1 to Alaskans,” Ballot Measure 1 sponsor Robin Brena stated. “Our opposition keeps conflating issues and causing confusion over even obvious things,” Brena explained, “so we thought we would lay out some of Ken’s detailed modeling to make the issues clearer for Alaskans.”
“As a consultant for Vote Yes, KMA Associates has done extensive modeling on Ballot Measure 1 to determine its impacts to both the producers in the three major legacy fields and to Alaska,” commented Alper, “I built a proprietary model for this project, which is similar to models I’ve used for many years to estimate oil and gas revenues in Alaska.” “The inputs are entirely from reliable and public sources published by the Alaska Department of Revenue,” Alper noted, “These sources included the Department’s Revenue Sources Book published each fall and updated each spring, annual reports on oil tax credits, and publicly available reports on certain field-specific lease expenditures on the North Slope. For those fields in which specific lease expenditure data is not publicly available, some extrapolation was necessary.” “The transparency the sponsors put into Ballot Measure 1 would help make this type of data more accessible,” Alper concluded.
Following is (1) a brief description of the modeling and slides released by Vote Yes today, (2) the Key Points illustrated by the modeling and slides, and (3) a link to this press release with the detailed analysis and slides attached on the Vote Yes web page:
Look-Back Slides 1-3: These slides set forth the actual net production taxes from 2009 through 2019, and compare the production taxes under SB21 with Ballot Measure 1 (the Fair Share Act) based on the five full fiscal years SB21 has been in effect (2015-2019) with and without cashable credits considered.
Key Points Illustrated by Look-Back Slides:
- Our net production taxes have collapsed from a five-year average of $3.8 billion before SB21 to less than zero after SB21.
- Since SB21, the State has paid and owes more in cashable credits ($2.1 billion) than it has received in production taxes ($2.0 billion).
- SB21, and not a change to the price of oil, is the primary driver behind the collapse of the State’s production taxes.
- When oil prices were $65 per bbl., the State recovered $12 per bbl. in production taxes before SB21 and $2 per bbl. after SB21.
- When the oil price remained the same from fiscal year 2013 (before SB21) to 2014 (SB21 was in effect for six months), our net production taxes declined by $1.6 billion.
- If Ballot Measure 1 had been in effect during the same five-year period SB21 has been in effect, Ballot Measure 1 would have resulted in $5.5 billion more in total production taxes or $1.1 billion more per year.
Order-of-Operations Slides 1-6. These slides compare a detailed order-of-operations calculation of the production taxes for the largest of the three major legacy fields, the Prudhoe Bay Unit, under SB21 and Ballot Measure 1 (the Fair Share Act) for 2018.
Key Points Illustrated by Order-of-Operations Slides:
- In 2018, the Prudhoe Bay Unit produced 106 million bbls. at an average oil price of $63.61 per bbl., which resulted in $6,744.7 million of market value.
- Production taxes on the market value are determined by the greater of a gross minimum tax calculation or a net tax calculation.
- The gross minimum tax calculation is based on gross value at the point of production times a rate. Both SB21 and Ballot Measure 1 calculate the gross value at the point of production the same for the Prudhoe Bay Unit at $5,055.5 million. Both SB21 and Ballot Measure 1 apply a rate based on the price of ANS oil, which was $63.61 per bbl. in 2018. At this price of ANS oil, SB21 applies a 4% rate and determines the gross minimum tax at $202.2 million. Ballot Measure 1 applies a 13% rate and determines the gross minimum tax at $657.2 million.
- The only difference between the gross minimum tax calculation under SB21 and Ballot Measure 1 is the rate applied to the gross value at the point of production. SB21 allows the rate to go to a 0% minimum floor, but the rate is 4% when ANS oil prices are over $25 per bbl. Ballot Measure 1 allows the rate to go to a 10% minimum floor. As a resource owner with significant oil resources, there is no justification for the State to take such massive downside risk at lower ANS oil prices when it has no control over managing the risk and gets so little of the benefit at higher ANS oil prices.
- The net tax calculation is based on net production value times a rate. SB21 permits and Ballot Measure 1 does not permit expenses unrelated to the Prudhoe Bay Unit to be deducted when determining the net production value of production from the Prudhoe Bay Unit. As a result, SB21 deducts unrelated expenses and determines the production tax value for production at the Prudhoe Bay Unit at $2,777 million, then applies a 35% rate to calculate the net tax calculated at $971.9 million. Ballot Measure 1 does not deduct unrelated expenses and determines the production tax value at $3,683.5 million, then applies a 35% rate to calculate a net tax calculated at $1,289.2 million.
- SB21 further permits the net tax calculated of $971.9 million to be reduced by an $8 per revenue bbl. credit or by $742.2 million for a net tax payable of $229.7 million. Ballot Measure 1 eliminates this $8 per revenue bbl. credit and requires the net tax calculated of $1,289.2 million to be the net tax payable. Thus, the net tax payable for production at the Prudhoe Bay Unit is $229.7 million under SB21 and $1,289.2 million under Ballot Measure 1.
- There is no justification for permitting unrelated expenses to be deducted from the net production value or for an $8 per revenue bbl. credit for production for the Prudhoe Bay Unit. The Prudhoe Bay Unit went into production over 40 years ago when the price of ANS oil was under $4 per bbl.
- The State should not permit deductions from the production taxes of the Prudhoe Bay Unit for unrelated expenses. For example, under SB21, ConocoPhillips is deducting the expenses of developing federal lands in NPR-A from our current production taxes from the Prudhoe Bay Unit. This is expected to reduce our production taxes and increase our State deficit by roughly $300 million per year for most of the next decade. There is no assurance the State will recover these lost production taxes. Also, new explorers are not able to deduct their expenses from our current production taxes at the Prudhoe Bay Unit. As a result, Ballot Measure 1 helps level the playing field between legacy producers and new explores.
- The State should also not permit $8 per revenue bbl. credits for production from the Prudhoe Bay Unit. This reduced the State’s production taxes by $742.2 million in 2018 alone. The producers have a legal obligation to produce the oil in the Prudhoe Bay Unit. They also receive an overwhelming economic benefit from producing the oil in the Prudhoe Bay Unit. Providing $742.2 million of credits for production that would have occurred anyway to producers that only invested $202 million of capital in the Prudhoe Bay Unit cannot be economically rationalized and is poor oil policy.
Look-Back Slides 1-3: These slides set forth the actual net production revenue from 2009 through 2019, and compare the production revenue under SB21 with Ballot Measure 1 (the Fair Share Act) based on the five full fiscal years SB21 has been in effect (2015-2019) with and without cashable credits considered.
Look-Back Slide 1: Production Taxes After Credits (2009-2019)
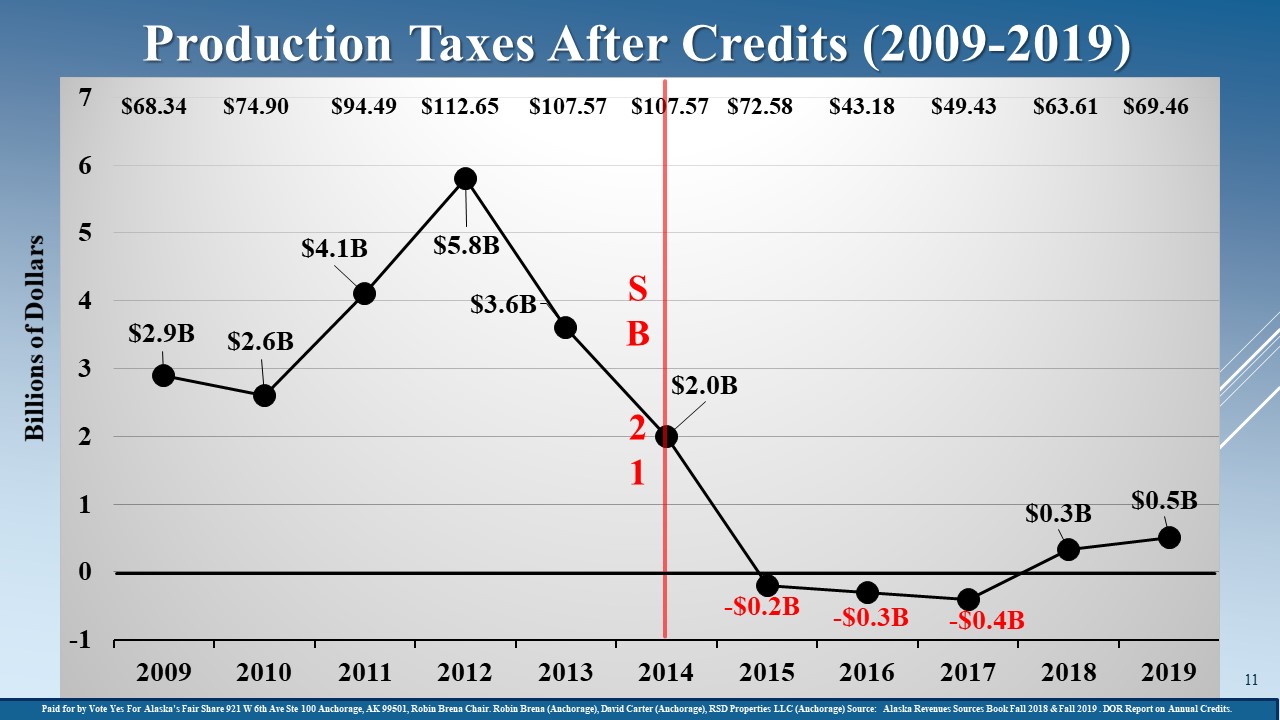
Look-Back Slide 1 sets forth the actual net production taxes for fiscal years 2009 through 2019. Net production taxes are the actual production taxes received by the State less the cashable credits paid and owned by the State for each year. For the five years before SB21 (2009-2013), Alaska’s net production taxes were $19 billion total or $3.8 billion per year. For the five years after SB21 (2015-2019), Alaska’s net production taxes were negative ($0.1) billion total or negative $(0.02) billion per year.
The ANS oil price for each year is on the top of Look-Back Slide 1. The average price of ANS oil was 35% higher during the 2009-2013 five-year period than in the 2015-2019 five-year period. Given comparable ANS oil prices, SB21 has a significant negative impact on production taxes. In 2013 and 2014, the price of ANS oil was identical at $107.57 per bbl., but net production taxes declined by $1.6 billion as the result of SB21. In 2009, the price of ANS oil was $68.34 per bbl., and Alaska recovered production taxes of $12.09 per bbl. without considering credits, while in 2015 under SB21, the price of ANS oil was $72.58 per bbl. (an increase of $4.24 per bbl. from 2009) and Alaska only recovered production taxes of $2.01 per bbl. without considering credits, or one-sixth as much as before SB21.
Look-Back Slide 1 illustrates the collapse of our net petroleum taxes from $3.8 billion per year to negative ($0.02) billion per year was primarily the result of SB21.
Look-Back Slide 2: Five-Year Lookback of Production Taxes under SB21 and Ballot Measure 1 (with Cashable Credits Considered).
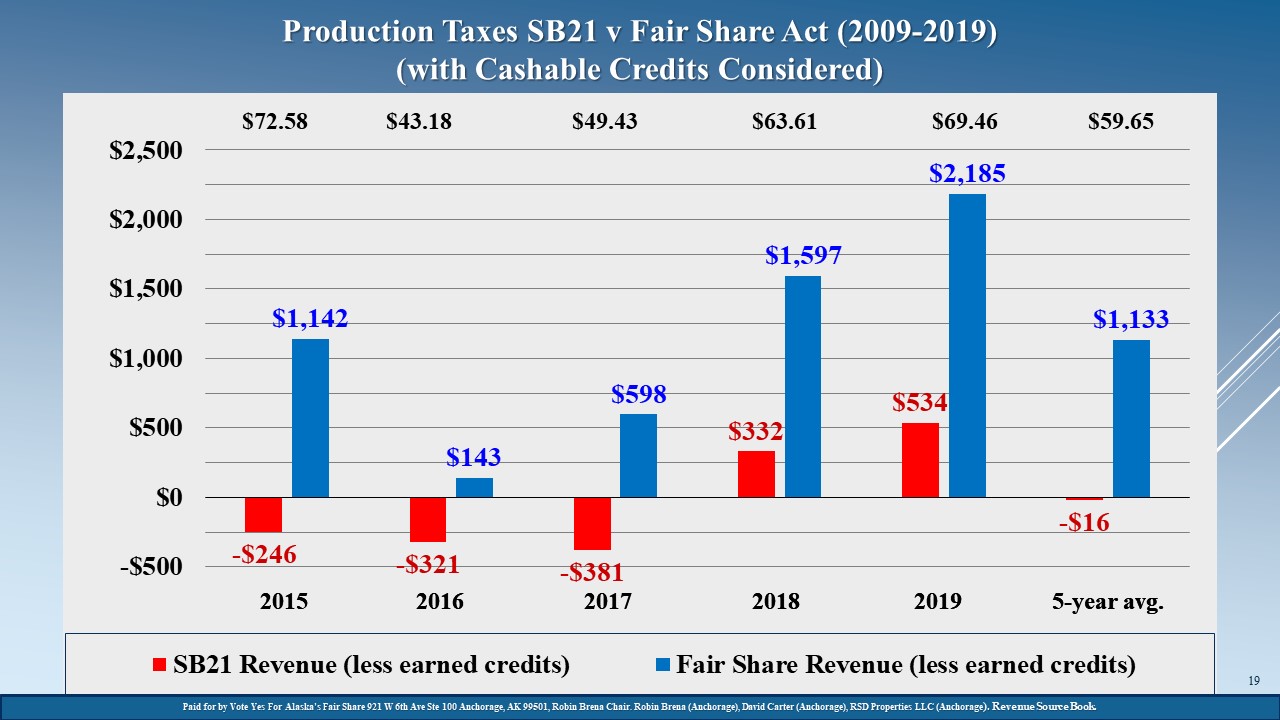
Look-Back Slide 2 compares the production taxes with cashable credits considered for the five fiscal years (2015-2019) under SB21 (actual) and under Ballot Measure 1 (modeled by Alper). SB21 resulted in negative production taxes in three of the five years with cashable credits considered. When the price of oil was $72.58 per bbl. in 2015, for example, the production taxes with cashable credits considered was negative ($246) million under SB21 and positive $1,142 million under Ballot Measure 1. The five-year average in production taxes with cashable credits considered was negative ($16) million under SB21 and positive $1,133 million under Ballot Measure 1 or a $1,117 million difference.
Look-Back Slide 2 demonstrates that under SB21 the State has paid the producers more in cashable credits than the producers have paid the State in production taxes. It also demonstrates that over a range of oil prices and circumstances during the past five years, Ballot Measure 1 would have resulted in average production taxes when cashable credits are considered of $1,117 million more than SB21.
Cashable credits are considered in this comparison because, when evaluating the performance of the current tax system, it is important to consider both the amount the State paid and still owes in cashable credits and the amount the State received in production taxes. While the cashable credit program has expired, the State continues to owe $738 million in cashable credits that it has not been able to pay as the result of the collapse of production taxes under SB21.
Look-Back Slide 3: Five-Year Lookback of Production Taxes under SB21 and Ballot Measure 1 (With and Without Cashable Credits Considered).

Look-Back Slide 3 compares the production taxes (with and without cashable credits considered) for five fiscal years (2015-2019) under SB21 and Ballot Measure 1. The results of Look-Back Slide 2 are represented in Look-Back Slide 3. In addition, Look-Back Slide 3 sets forth the production taxes without cashable credits considered. The five-year average in production taxes without cashable credits considered was $403 million under SB21 and $1,552 million under Ballot Measure 1 or a $1,149 million difference.
Look-Back Slide 3 demonstrates that without considering cashable credits over the five-year period, Ballot Measure 1 recovered a minimum of $464 million (2016) when the price of oil was $43.18 per bbl. and a maximum of $1,651 million (2019) when the price of oil was $69.46 per bbl. On average, Look-Back Slide 3 shows that, even when cashable credits are not considered, Ballot Measure 1 would recover roughly $1.1 billion per year more than SB21 during the five-year period (2015-2019) SB21 has been in effect. Thus, the differences in the production taxes between SB21 and Ballot Measure 1 are roughly the same with or without cashable credits considered.
Order-of-Operations Slides 1-6. These slides compare a detailed order-of-operations calculation of the production taxes for the largest of the three major legacy fields, the Prudhoe Bay Unit, under SB21 and Ballot Measure 1 (the Fair Share Act) for 2018.
Order-of-Operations Slides 1-6 provide a six-step order of operations calculation of production taxes that compares the calculation of production taxes for the Prudhoe Bay Unit under SB21 and the Fair Share Act for 2018. The Prudhoe Bay Unit was chosen for the detailed comparison because most of the additional production taxes under Ballot Measure 1 are the result of additional taxes from the Prudhoe Bay Unit. The Prudhoe Bay Unit is the largest conventional oil field in North America. It is a low-cost, high-profit field that has been in production since 1977 and was authorized to be developed and the Trans Alaska Pipeline System to be built when the price of oil was under $4 per bbl.
These Order-of-Operations Slides demonstrate both the similarities and the primary differences between SB21 and Ballot Measure 1. The primary reasons Ballot Measure 1 increases the production taxes from the Prudhoe Bay Unit is because Ballot Measure 1 no longer permits costs unrelated to the production of oil from the Prudhoe Bay Unit to be deducted from the production taxes of the Prudhoe Bay Unit and because Ballot Measure 1 eliminates the unnecessary $8 per revenue bbl. credits for production from the Prudhoe Bay Unit.
Order-of-Operations Slide 1: Step One—Calculation of Market Value.
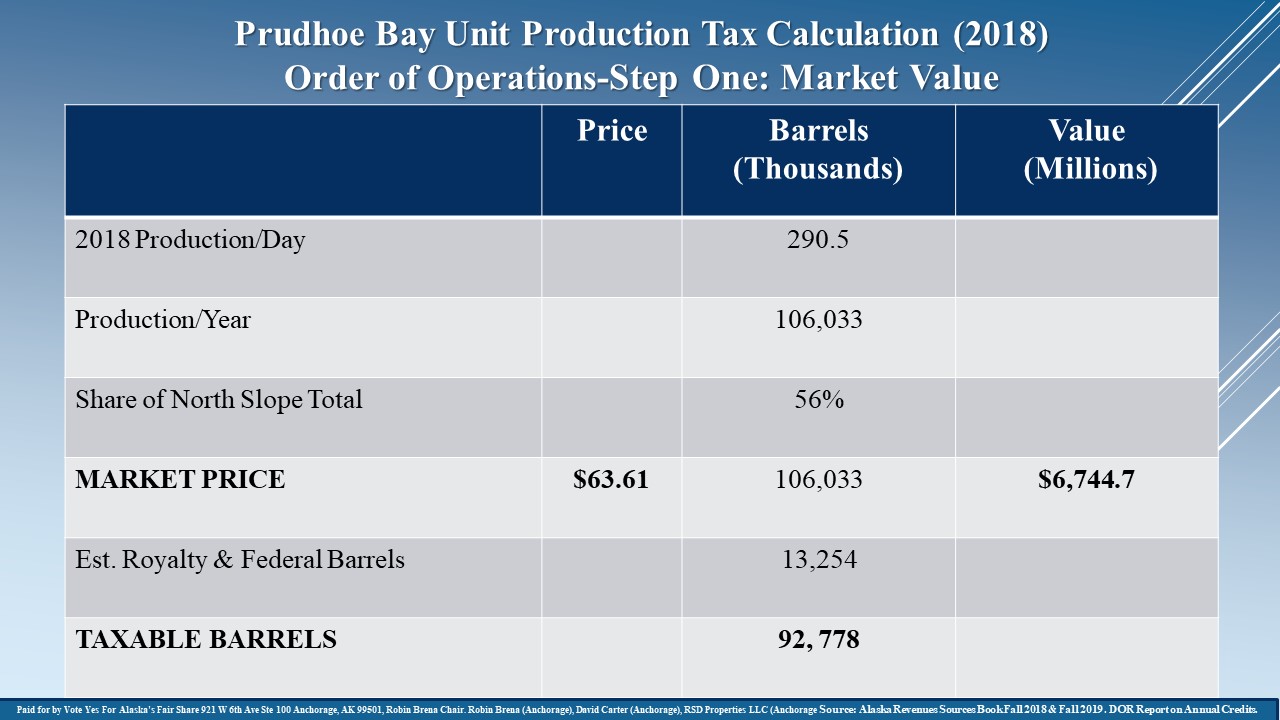
Order-of-Operations Slide 1 shows step one in the calculation of production taxes: the calculation of the market value on the West Coast of crude oil produced from the Prudhoe Bay Unit in 2018. Ballot Measure 1 does not amend SB21 with regard to the calculation of the market value, so step one is the same under SB21 and Ballot Measure 1.
Market value is calculated by multiplying the total production for the Prudhoe Bay Unit by the average ANS (West Coast) crude oil price, as reported in the Revenue Sources Book for 2018. Order-of-Operations Slide 1 also breaks out the royalty and federal barrels of production from the revenue barrels of production because only revenue barrels are subject to production taxes.
Order-of-Operations Slide 1 demonstrates that in 2018, the Prudhoe Bay Unit produced 106 million barrels at a price of $63.61 per bbl. or $6,744.7 million in total market value.
Order-of-Operations Slide 2: Step Two—Deduction of Transportation Expenses.
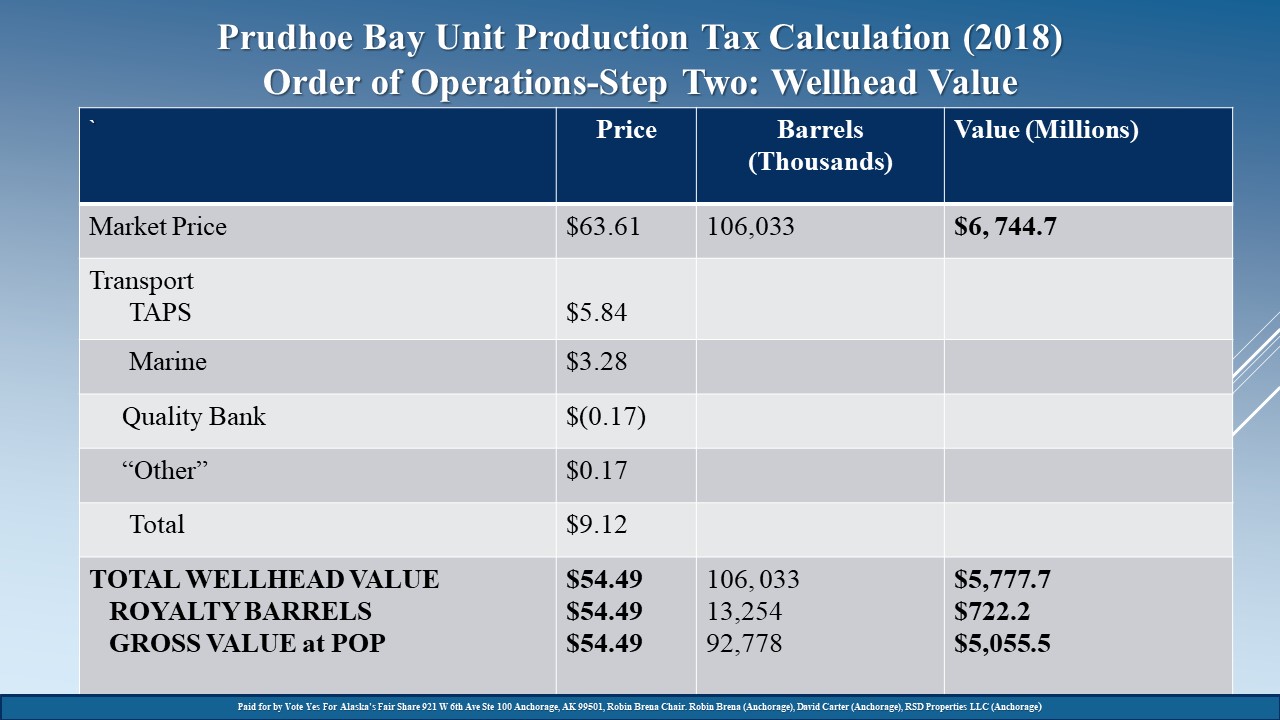
Order-of-Operations Slide 2 shows step two in the calculation of production taxes: the calculation of the wellhead value of crude oil produced from the Prudhoe Bay Unit in 2018. Ballot Measure 1 does not amend SB21 with regard to the calculation of the wellhead value, so step two is the same under SB21 and Ballot Measure 1.
The wellhead value is calculated by subtracting the transportation expenses to the West Coast from the market value on the West Coast. The primary transportation expenses are for pipeline ($5.84 per bbl.) and marine transportation ($3.28 per bbl.).
Order-of-Operations Slide 2 shows the total market value on the West Coast of $6,744.7 million, less the transportation expenses of $967 million, for a total wellhead value at the Prudhoe Bay Unit of $5,777.7 million. It also shows the wellhead value of the royalty barrels, or $722.2 million, is deducted from the wellhead value of $5,777.7 million to calculate the wellhead value of the remaining revenue barrels, or $5,055.5 million.
Order-of-Operations Slide 2 demonstrates that transportation expenses are subtracted before the production taxes are determined and so are borne by both the producers and the State. Transportation expenses also include the profits and tax allowances associated with transportation by the major producers’ affiliated pipeline and marine companies.
Order-of-Operations Slide 3: Step Three—Deduction of Lease Expenditures.
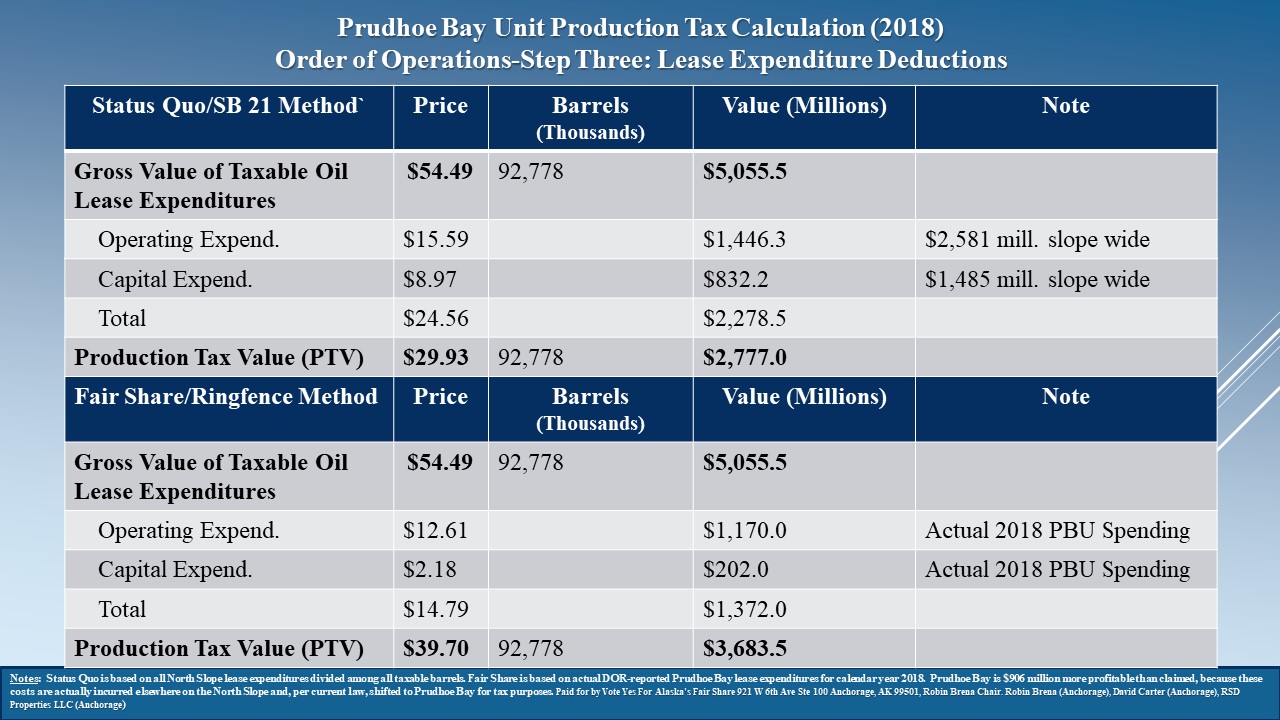
Order-of-Operations Slide 3 shows step 3 in the calculation of production taxes: the deduction of lease expenditures from the Prudhoe Bay Unit in 2018. Ballot Measure 1 does amend SB21 with regard to the deduction of lease expenditures, so step three is significantly different under SB21 and Ballot Measure 1.
SB21 permits expenses unrelated to producing oil from the Prudhoe Bay Unit to be deducted from the calculation of production taxes from the Prudhoe Bay Unit. Specifically, SB21 permits the deduction of prorated ANS-wide expenses (that includes significant expenses unrelated to the Prudhoe Bay Unit) of $1,446.3 million in total or $15.59 per bbl. in operating expenses and $832.2 million in total or $8.97 per bbl. in capital expenses. Deducting expenses that includes those expenses unrelated to the Prudhoe Bay Unit results in production tax value in 2018 of $2,777 or $29.93 per bbl. under SB21.
Ballot Measure 1 limits the deductions to only those expenses that are related to the Prudhoe Bay Unit. This is sometimes referred to as “ring fencing.” Specifically, Ballot Measure 1 only permits the actual expenses related to the Prudhoe Bay Unit of $1,170 million in total or $12.61 per bbl. in operating expenses and of $202 million in total or $2.18 per bbl. in capital expenses. Limiting deductions to expenses related to the Prudhoe Bay Unit results in production tax value in 2018 of $3,683.5 or $39.70 per bbl. under Ballot Measure 1.
Allowing legacy producers to deduct expenses unrelated to the Prudhoe Bay Unit under SB21 significantly reduces the State’s production taxes, results in an unfair competitive advantage for legacy producers over new explorers, and exposes the State’ production taxes to substantial and unnecessary future risk or loss. For example, the State has calculated that ConocoPhillips’ spending in NPR-A may reduce the State’s production taxes by roughly $300 million per year for most of the next decade, and it is not clear whether or when the State may ever recover these lost revenues.
Order-of-Operations Slide 4: Step Four—Calculation of Gross Minimum Tax.
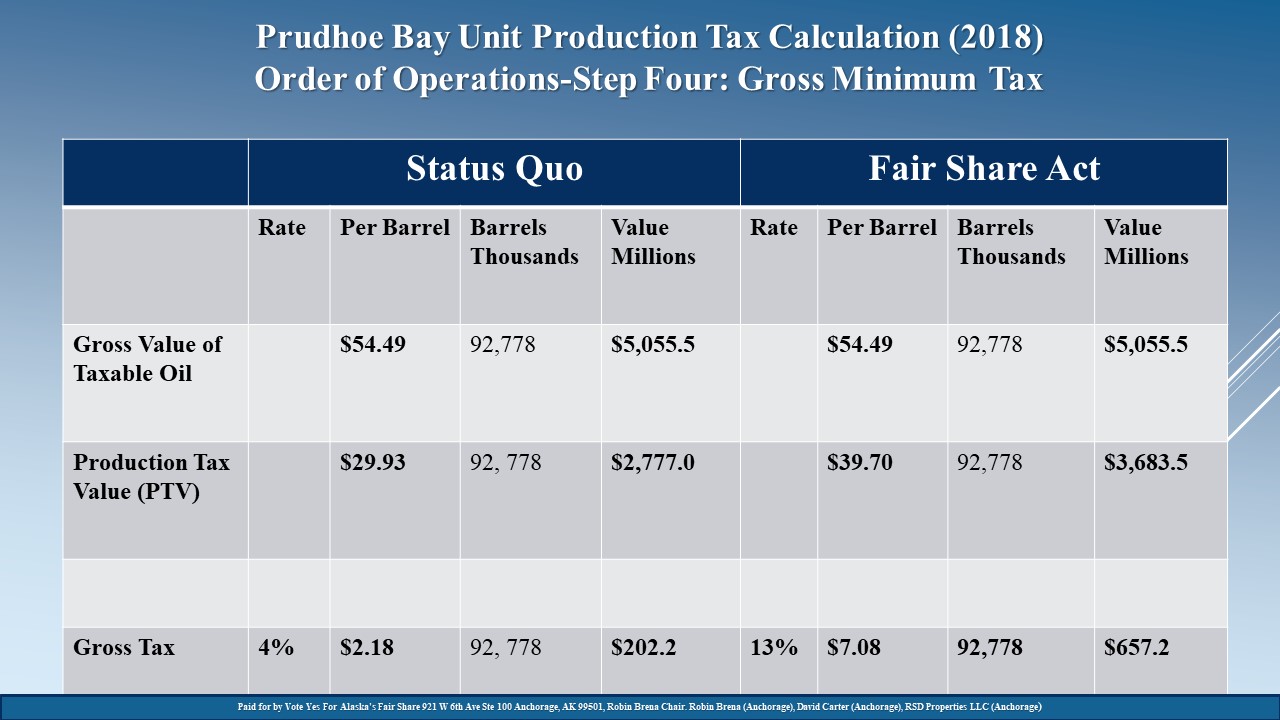
Order-of-Operations Slide 4 shows step 4 in the calculation of production taxes: the calculation of the gross minimum tax for the Prudhoe Bay Unit in 2018. Both SB21 and Ballot Measure 1 calculate the gross minimum tax based on the gross value of taxable oil at the wellhead, but they apply different rates.
Under SB21, when the price of ANS oil on the West Coast is greater than $25 per bbl., the rate is 4%. This 4% rate under SB21 does not increase progressively as the price of oil increases above $25 per bbl. Since the price of ANS oil was $63.61 per bbl. in 2018, the minimum gross tax would be 4% of the $5,055.5 gross value of taxable oil at wellhead or $202.2 million under SB21.
Under Ballot Measure 1, when the price of ANS oil is equal to or greater than $60 per bbl. and under $65 per bbl., the rate is 13%. This rate is based on a floor rate of 10% below $50 per bbl. and increases by 1% up to a maximum of 15% for each $5 increase in the price of ANS oil. Since the price of ANS oil was $63.61 per bbl. in 2018, the minimum gross tax would be 13% of the $5,055.5 gross value of taxable oil at wellhead or $657.2 million under Ballot Measure 1.
Also, SB21 sets the rate applied to the gross minimum tax annually while Ballot Measure 1 sets the rate monthly. This example assumes the price of oil was constant throughout 2018. To the degree the price of oil varied from month to month, Ballot Measure 1 would apply the appropriate rate to each month. This allows the State to have a 10% floor rate and share in the benefits when the price of oil temporarily spikes.
Order-of-Operations Slide 5: Step Five—Calculation of Net Tax.
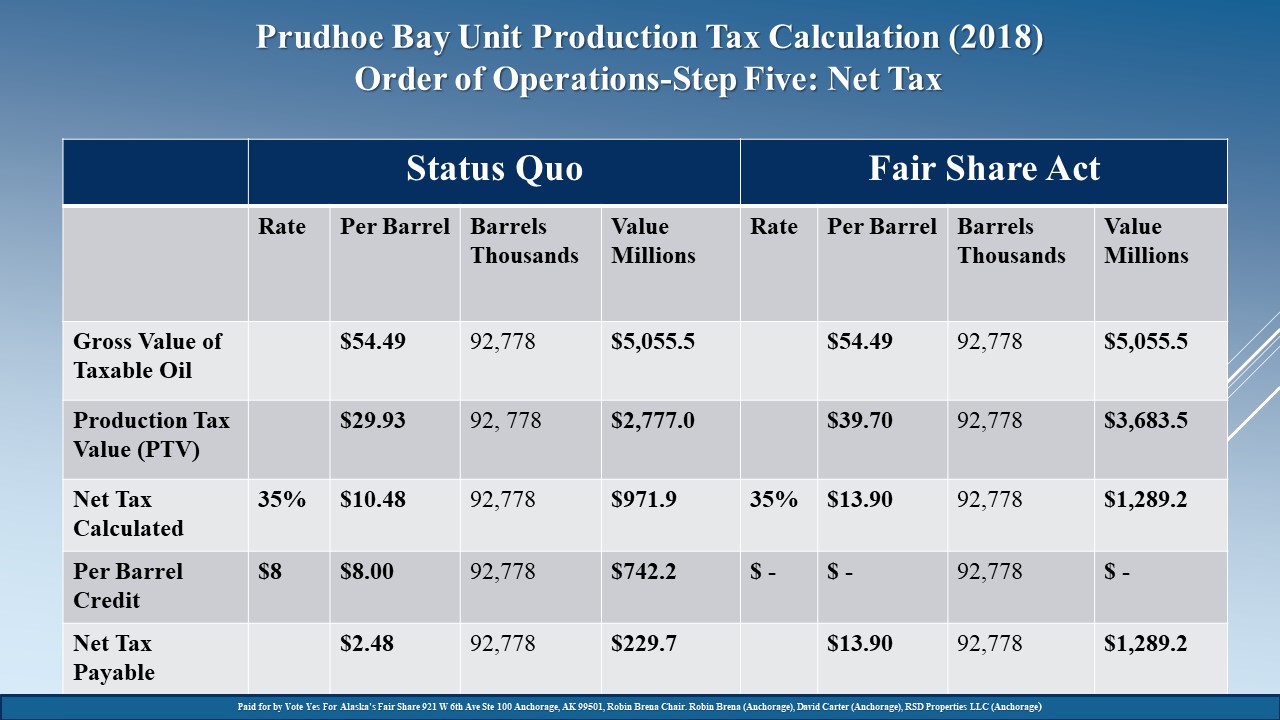
Order-of-Operations Slide 5 shows step 5 in the calculation of production taxes: the calculation of the net tax for the Prudhoe Bay Unit in 2018. Both SB21 and Ballot Measure 1 calculate the net tax based on the production tax value. As explained in Order-of-Operations Slide 3, however, because SB21 permits expenses unrelated to the Prudhoe Bay Unit to be deducted and Ballot Measure 1 does not, the production tax value under SB21 is $2,777 million while the production tax value under Ballot Measure 1 is $3,683.5 million.
When the price of ANS oil is $63.61 per bbl., both SB21 and Ballot Measure 1 apply a 35% rate to the production tax value to determine the net tax. Under SB21, 35% of the production tax value of $2,777 million results in a net tax calculated of $971.9 million. Under Ballot Measure 1, 35% of the production tax value of $3,683.5 million results in a net tax calculated and payable of $1,289.2 million.
Notably, SB21 reduces the net tax calculated through applying $8 per revenue bbl. credits. Since there were 92,778 million revenue bbls. produced from the Prudhoe Bay Unit in 2018, SB21 provides a $742.2 million credit against the net tax calculated that reduces the net tax payable from $971.9 million to $229.7 million.
Because the producers in the Prudhoe Bay Unit are legally obligated to produce the oil and there is no economic justification for $8 per revenue bbl. credits for the largest and most profitable conventional oil field in North America that has been producing oil for over 40 years without such credits, Ballot Measure 1 eliminates the $8 per revenue bbl. credits. As the result, under Ballot Measure 1, the net tax calculated of $1,289.2 million is not reduced through the $8 per revenue bbl. credits.
SB21’s award of $8 per revenue bbl. credits or $742.2 million for oil that would have been produced anyway without any credits is perhaps the largest single difference between SB21 and Ballot Measure 1. SB21 provided $742 million in $8 per revenue bbl. credits in 2018 even though the producers only invested $202 million of capital in the Prudhoe Bay Unit.
As the result of limiting deductions to expenses associated with the Prudhoe Bay Unit and eliminating the $8 per revenue bbl. credits, Ballot Measure 1 would realize $1,289.2 million in net tax while SB21 would realize $229.7 million in net tax—a $1,059.5 million difference.
Order-of-Operations Slide 6: Step Six—Calculation of “Higher of” Gross Minimum Tax and Net Tax.
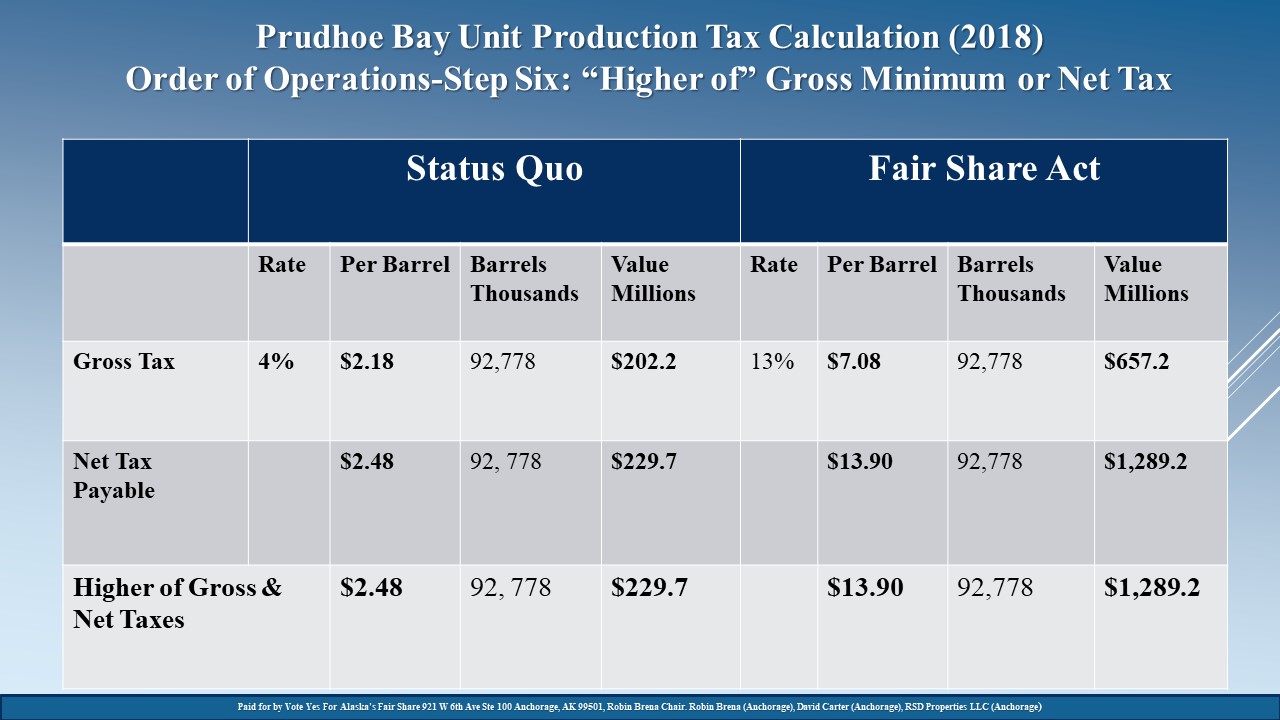
Order-of-Operations Slide 6 shows step 6 in the calculation of production taxes: the application of the “greater of” the gross minimum tax or the net tax. Production taxes are based on the “greater of” the gross minimum tax or the net tax.
Under SB21 for 2018, the gross minimum tax was $202.2 million and the net tax was $229.7 million. The “greater of” these two taxes results in the State collecting the net tax of $229.7 million under SB21.
Under Ballot Measure 1 for 2018, the gross minimum tax was $657.2 million and the net tax was $1,289.2 million. The “greater of” these two taxes would result in the State collecting the net tax of $1,289.2 million under Ballot Measure 1—$1,059.5 million more than under SB21.
To put this in context, the Prudhoe Bay Unit produced $3,683.5 million of net income after all expenses and royalties were considered in 2018. Under SB21, the State’s share of this $3,683.5 million was only $229.7 million in production taxes. Under Ballot Measure 1, the State’s share of this $3,683.5 million would have been $1,289.2 million.
###


